|
|
|
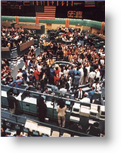
Key Market Day Key Market Day does not imply that the particular trading instrument discussed below will continue in the direction of the pattern signal. It implies that the trading instrument itself and similar like trading instruments had impact on other different types of futures markets. With that said, via the 15min chart...take a look at the XAU.X Phlx Gold & Silver Sector Index. There was a support/resistance zone established on December 28th that proved to be to tough for Gold to break through on Jan 3rd. In fact, soon after the Open the market for Gold and similar like trading instruments became bearish around 10am in the first two intervals. Our client exited his short position at the designated profit targets to a WRB pt3 level. In fact, if you look at pt1 and pt2 you will see that those two particular WRBs occurred within the range of prior WRBs while pt3 was obviously a volatility blow off spike. Trading Instrument: COMEX Gold GC Futures Price Action Pattern source: Swing Trading Report (STR)
Click on chart to view actual size If you have any questions about either the price action involving the pattern signal or the pattern signal itself... You can send email to questions@thestrategylab.com Also, to view the archives of what we consider to be key market days along with the clues associated with the key price action...click here. Disclaimer: The above chart in the key chart stories is for illustration only and they represent trades (real money or simulator) of those traders that have access to either our special free strategy, trading reports or trading manual. To read our full disclaimer statement...click here.
|
|